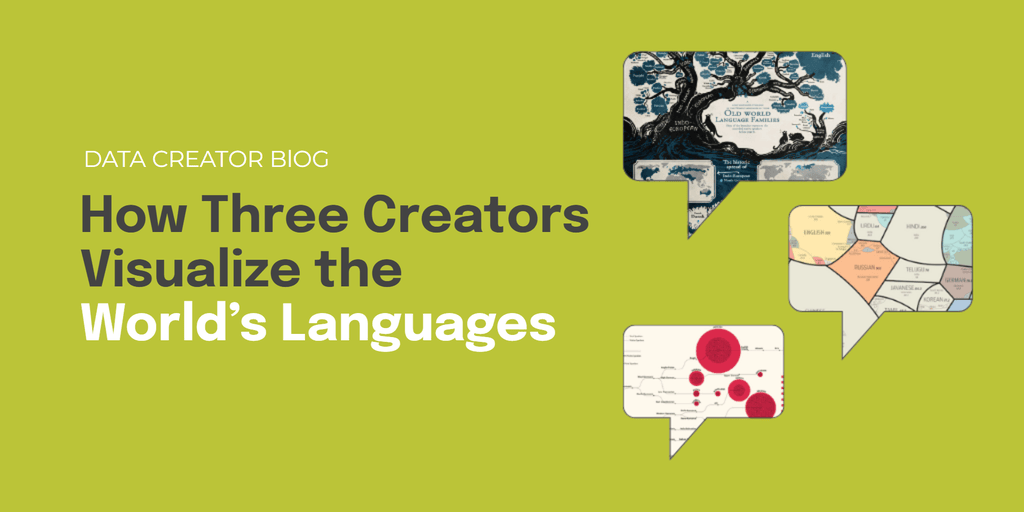
How Three Creators Visualize the World’s Languages
Thousands of living languages exist today, overlapping across geography, ancestry, and identity. Turning that complexity into something people can see and understand is no easy task.
Designers and researchers have taken on this challenge in different ways: some focusing on structure and scale, others on heritage and evolution. Each offers a glimpse into how data visualization can make connection visible.
Below are three examples that explore this idea in distinct ways.
#1 Wordtips: The 100 Most Spoken Languages

Using data from Ethnologue, Wordtips charted the 100 most spoken languages in the world, comparing native and total speakers.
The result is a clean, balanced view of how languages span populations and continents.
Why It Works
Color and scale do most of the work. Grouped language families make it easy to trace connections, while proportional sizing reveals key contrasts.
You can immediately see that Mandarin and Spanish dominate in native speakers for instance, while Indonesian and Swahili grow through second-language adoption.
What Creators Can Learn
When a dataset covers the entire world, the key is finding a lens that still feels personal.
Wordtips does this well—it helps people locate themselves in the data, whether by language, region, or connection to others. That clarity comes from a simple visual hierarchy and a focused story. When one relationship leads the narrative, the chart doesn’t need extra panels competing for attention.
And if you’re designing a similarly crowded visual, keep it readable by simplifying labels and numbers and tightening the legend so the eye doesn’t have to work as hard.
#2 SCMP’s “All the World Languages” by Alberto Lucas López

Few visualizations have captured global attention like this one.
Created by infographic journalist Alberto Lucas López for the South China Morning Post, the piece uses a nested Voronoi diagram to show that just 23 major languages account for the mother tongues of more than 4 billion people.
Why It Works
The layout feels easy on the eyes. Each shape stands for a language, grouped by region and sized by how many people speak it natively. Bigger clusters flow into smaller ones, so you naturally move from one part of the world to another.
The colors stay consistent, and the spacing gives everything room to breathe. This makes it surprisingly simple to follow, even with so much going on. That sense of flow also helps the design work on small screens, where clarity and rhythm matter even more.
What Creators Can Learn
With visuals this detailed, flow is everything. The design works because it gives you an entry point, then gradually adds more to explore.
When the structure feels natural, people don’t think about “reading” the chart—they just get it.
#3 Minna Sundberg’s “Old World Language Families”

Sometimes a data story comes from an unexpected place.
Finnish-Swedish artist Minna Sundberg included a language family tree in her webcomic Stand Still, Stay Silent, tracing linguistic roots before the year 0.
Though created for narrative context, it has since become one of the most recognized visualizations of language ancestry.
Why It Works
What makes this visualization work is the metaphor.
The branches and roots show how languages grow, split, and influence each other over time. The whole visual feels alive—more like something that’s evolving than a static chart.
It’s creative and expressive, but still grounded in real Ethnologue data, giving it the right mix of character and credibility.
What Creators Can Learn
For creators, it’s a reminder that a metaphor can be a bridge between logic and emotion. When your visual form reflects your subject, understanding happens naturally and stays with the viewer.
Bringing It All Together
Visualizing language shows that clarity alone isn’t enough.
The strongest work blends logic with intuition, scale with sensitivity, and structure with story. Each visualization finds a way to make data feel alive and connected to the human experience.
A few lessons stand out:
- Design for orientation. Let people locate themselves in the map—by family, region, or native vs. total speakers—so the visual feels personally relevant.
- Pace the reading. Use grouping, spacing, and cell size to create a visual rhythm that guides attention through dense areas without fatigue.
- Match form to meaning. Pick metaphors and aesthetics that reflect the topic’s nature, not just what looks good.
Great data storytelling doesn’t just reveal information, it helps people feel the connections it represents. What connection are you looking to highlight in your next visual?
