How Three Creators Visualize the World’s Languages

Thousands of living languages exist today, overlapping across geography, ancestry, and identity. Turning that complexity into something people can see and understand is no easy task.

Designers and researchers have taken on this challenge in different ways: some focusing on structure and scale, others on heritage and evolution. Each offers a glimpse into how data visualization can make connection visible.

Below are three examples that explore this idea in distinct ways.

#1 Wordtips: The 100 Most Spoken Languages

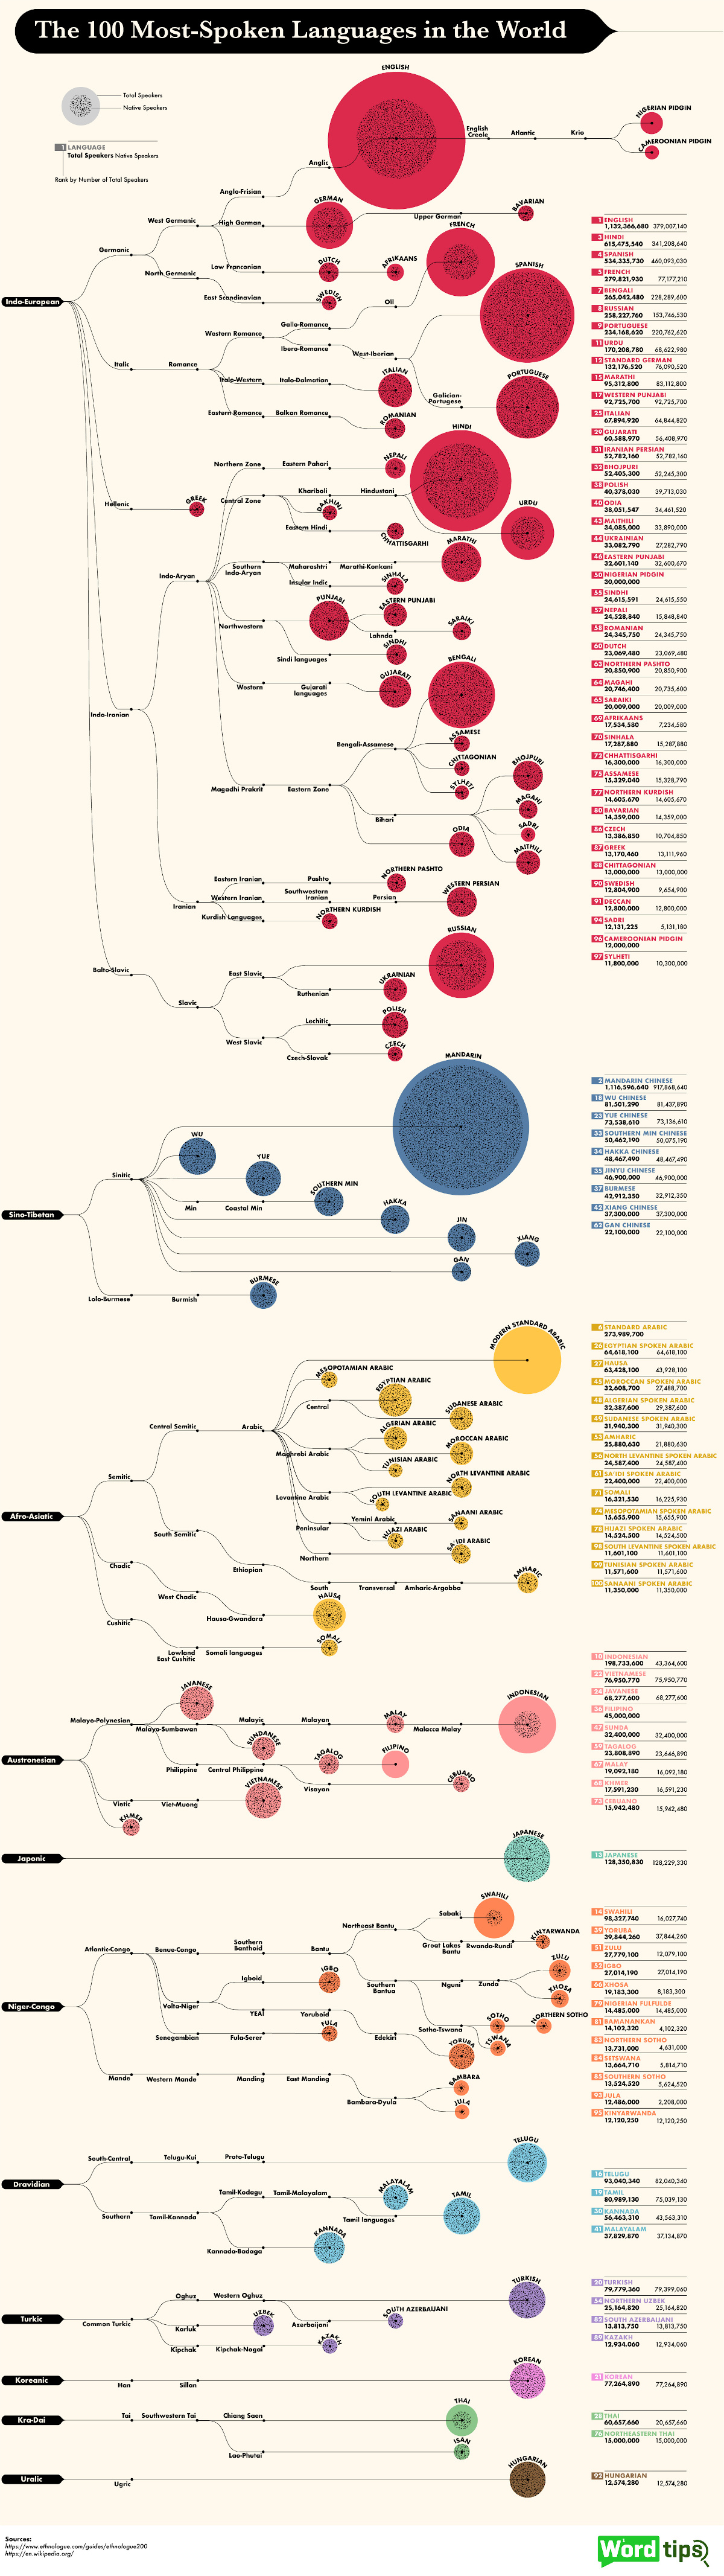
Using data from Ethnologue, Wordtips charted the 100 most spoken languages in the world, comparing native and total speakers.

The result is a clean, balanced view of how languages span populations and continents.

Why It Works 

Color and scale do most of the work. Grouped language families make it easy to trace connections, while proportional sizing reveals key contrasts.

You can immediately see that Mandarin and Spanish dominate in native speakers for instance, while Indonesian and Swahili grow through second-language adoption.

What Creators Can Learn

When a dataset covers the entire world, the key is finding a lens that still feels personal.

Wordtips does this well—it helps people locate themselves in the data, whether by language, region, or connection to others. That clarity comes from a simple visual hierarchy and a focused story. When one relationship leads the narrative, the chart doesn’t need extra panels competing for attention.

And if you’re designing a similarly crowded visual, keep it readable by simplifying labels and numbers and tightening the legend so the eye doesn’t have to work as hard.

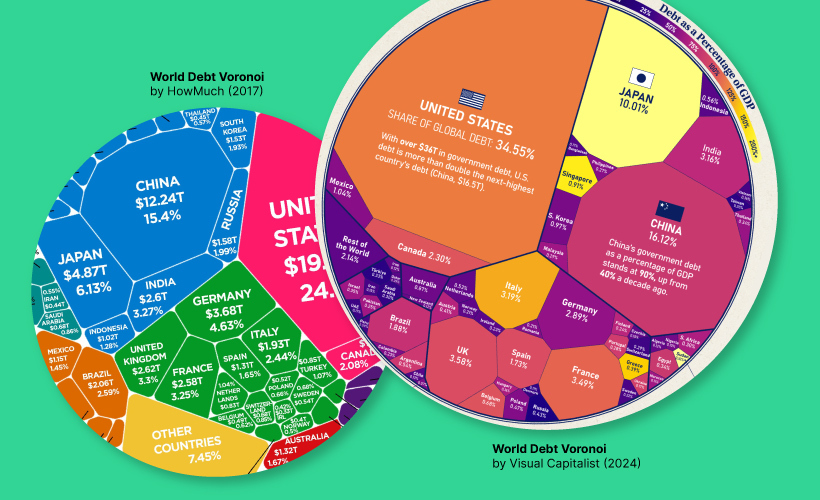
#2 SCMP’s “All the World Languages” by Alberto Lucas López

Few visualizations have captured global attention like this one.

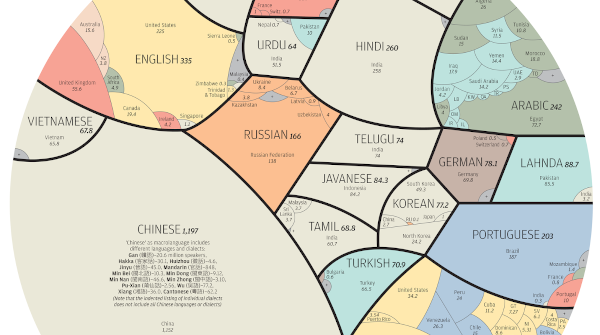
Created by infographic journalist Alberto Lucas López for the South China Morning Post, the piece uses a nested Voronoi diagram to show that just 23 major languages account for the mother tongues of more than 4 billion people.

Why It Works 

The layout feels easy on the eyes. Each shape stands for a language, grouped by region and sized by how many people speak it natively. Bigger clusters flow into smaller ones, so you naturally move from one part of the world to another.

The colors stay consistent, and the spacing gives everything room to breathe. This makes it surprisingly simple to follow, even with so much going on. That sense of flow also helps the design work on small screens, where clarity and rhythm matter even more.

What Creators Can Learn

With visuals this detailed, flow is everything. The design works because it gives you an entry point, then gradually adds more to explore.

When the structure feels natural, people don’t think about “reading” the chart—they just get it.

#3 Minna Sundberg’s “Old World Language Families”

Sometimes a data story comes from an unexpected place.

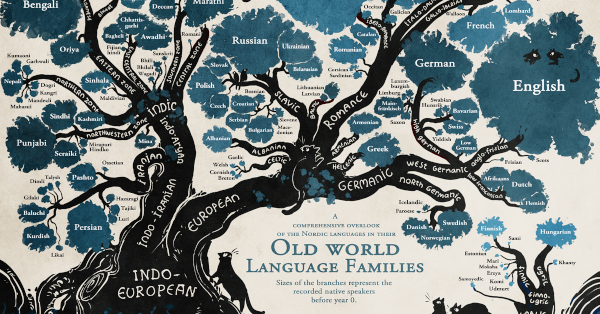
Finnish-Swedish artist Minna Sundberg included a language family tree in her webcomic Stand Still, Stay Silent, tracing linguistic roots before the year 0.

Though created for narrative context, it has since become one of the most recognized visualizations of language ancestry.

Why It Works 

What makes this visualization work is the metaphor.

The branches and roots show how languages grow, split, and influence each other over time. The whole visual feels alive—more like something that’s evolving than a static chart.

It’s creative and expressive, but still grounded in real Ethnologue data, giving it the right mix of character and credibility.

What Creators Can Learn

For creators, it’s a reminder that a metaphor can be a bridge between logic and emotion. When your visual form reflects your subject, understanding happens naturally and stays with the viewer.

Bringing It All Together

Visualizing language shows that clarity alone isn’t enough.

The strongest work blends logic with intuition, scale with sensitivity, and structure with story. Each visualization finds a way to make data feel alive and connected to the human experience.

A few lessons stand out:

  • Design for orientation. Let people locate themselves in the map—by family, region, or native vs. total speakers—so the visual feels personally relevant.
  • Pace the reading. Use grouping, spacing, and cell size to create a visual rhythm that guides attention through dense areas without fatigue.
  • Match form to meaning. Pick metaphors and aesthetics that reflect the topic’s nature, not just what looks good.

Great data storytelling doesn’t just reveal information, it helps people feel the connections it represents. What connection are you looking to highlight in your next visual?

When the World Turned to Data: Lessons from COVID Visualizations

When COVID-19 spread globally, data became a shared language.

Charts, dashboards, and scatterplots were no longer niche—they were how billions made sense of a rapidly changing world.

From infection curves to risk maps, visualizations became the defining storytelling tool of the era. Some clarified uncertainty, while others added confusion.

Here, we look back to reveal powerful lessons for today’s creators on how to make data human, clear, and trustworthy in moments that matter.

The Dataset Behind the Story

As workplaces shut down, one question echoed across industries: “How risky is my job?”

To answer it, journalists and researchers turned to O*NET—the U.S. Department of Labor’s comprehensive database of occupations. It quantifies hundreds of roles based on attributes like physical proximity, contact with others, and exposure to disease.

By pairing those attributes with income data, storytellers could reveal which jobs carried the greatest health and economic risks. What followed were some of the most widely shared visualizations of the pandemic, each taking a different approach to clarity and empathy.

#1 The New York Times

This interactive scatterplot by The New York Times mapped proximity and exposure for hundreds of jobs, with bubble size showing occupation size.

Why it worked:

  • Guided scrolling highlighted key professions and built narrative flow.
  • Minimal labels kept it clean and explanatory.
  • Hover details added income context, connecting health risk to economic impact.

In short, this visualization is a masterclass in balancing depth with simplicity, and letting the data tell the story.

#2 Politico

Politico visualized proximity vs. income, linking physical exposure and financial insecurity.

Why it worked:

  • Color consistency unified text and chart.
  • Highlights directed focus to the most vulnerable groups.
  • Restraint in labeling emphasized broader patterns.

By pairing risk with income, the visualization turned statistics into empathy–showing not just who was vulnerable, but why

#3 Brookfield Institute

The Brookfield Institute for Innovation + Entrepreneurship in Canada visualized proximity and frequency of exposure to disease.

Why it worked:

  • Grouping similar occupations made the scroll experience narrative.
  • Plain-language labeling kept it accessible to all readers.
  • Highlighting select jobs gave viewers familiar reference points.

This visualization is a reminder that language clarity and visual hierarchy are as vital as the data itself.

#4 Visual Capitalist

The Visual Capitalist version used static scatterplots, combining proximity, contact, and exposure against income to map four quadrants of occupational risk:

  • High pay / low risk
  • High pay / high risk
  • Low pay / low risk
  • Low pay / high risk

Color coding distinguished healthcare roles, underscoring their heightened danger. Even without interactivity, the clean structure and visual contrast made it instantly understandable and highly shareable.

Lessons for Today’s Creators

These visualizations did more than show risk—they built understanding. In a time of confusion, they gave people a way to locate themselves in the data and see meaning in the numbers.

That’s the timeless principle of great data storytelling: clarity, empathy, and trust. Your next visualization could do the same.

Evolving Your Data Storytelling: Pushing Past the Obvious

When data visualization and accessible insights were still relatively new to mainstream audiences, simple revelations could captivate viewers.

“Finland is the happiest country” or basic economic comparisons felt genuinely surprising. There was abundant low-hanging fruit in both topics and visual storytelling approaches.

But success in the creator economy creates its own challenges. As creators have collectively educated audiences over the years, each piece of content makes viewers incrementally more sophisticated, raising their expectations.

The insights that once seemed revelatory—like basic country comparisons or simple trend visualizations—are now common knowledge across social platforms.

The waterline for what’s interesting keeps rising.

Publishing familiar concepts in familiar ways yields diminishing returns over time. Views decline. Engagement drops. Many creators eventually see this pattern across their “reliable” content topics that once drove consistent performance.

Three Strategies to Stay Ahead

Here are three things you can implement in your Voronoi content right now:

1) Make the “so what” explicit

People often engage with data content out of curiosity or because a visualization looks compelling. Always reward that initial interest with a real insight or takeaway.

Even if it’s not immediately actionable, it should feel worth their time. Don’t assume your audience will connect the dots—spell out why this data matters and what story it’s really telling.

2) Build trust through transparency

Today’s audiences are appropriately skeptical of data and claims they see online. When people encounter your Voronoi content, whether shared directly or discovered through other platforms, they’re increasingly met with comments questioning data sources and methodology.

Build trust by predicting where viewers might get confused or skeptical. Address potential concerns through clear sourcing, methodology notes, or context boxes so your content is self-defending without appearing defensive. This is the “trust” half of the trust-and-attention equation that drives sustainable growth.

3) Refresh the familiar

When you revisit proven concepts or trending topics, give them a fresh twist.

Add a second layer of analysis, highlight a new angle, or bring in comparisons that haven’t been explored before.

Pay attention to comments on similar content—what confused or frustrated people last time? Address those gaps so your take feels sharper and more relevant.

The Evolution Imperative

The creator economy is evolving quickly, and what worked six months ago might not work today.

But this challenge is also an opportunity. Creators who adapt and evolve their approach, and who recognize that audiences are getting smarter and more discerning, are the ones who will thrive on platforms like Voronoi.

Your work as data storytellers and visualization creators is a genuinely positive contribution to society. You’re helping make complex information accessible and engaging. The key is staying one step ahead of the rising expectations, continuing to surprise and inform audiences who are becoming more sophisticated every day.

The bar keeps rising, and your next visualization could set the new standard. Ready to share?

3 Simple Ways to Make Your Data Visualizations Clearer

In the fast-paced world of online content, data visualizations have to work hard. They need to be clear, concise, and immediately understandable—especially for audiences scrolling on mobile. Small design missteps can easily distract from the story you’re trying to tell.

Here are three simple but powerful tips to help your charts and graphics cut through the noise.

1. Simplify Labels and Numbers

One of the most common problems we see is label clutter. When space is tight—especially in charts with many small values—overly detailed labels can overwhelm the visual. This happens when creators use too many decimal places or insist on listing full official names for countries or companies.

Ask yourself:

  • How precise does this really need to be? For example, is 213.456 million necessary, or will 213M do the job?
  • Is brevity clearer? Instead of spelling out Democratic Republic of the Congo, could you simply use DRC?

Small tweaks like this can make your graphic cleaner and easier to digest.

2. Focus on One Main Chart

It’s tempting to try to tell your whole story in one big graphic. In fact, a decade ago, it was still fairly normal to create expansive long form infographics (like this classic Visual Capitalist post on Jade). But today, attention spans are shorter, and most content is consumed on small screens. You need to get your point across quickly.

Trying to show two or three charts in the same space often dilutes your message. If you must include extra charts as supporting data, either:

  • Give one chart clear priority and design the rest as secondary, or
  • Split the information into a slideshow or separate visuals.

A single, well-executed chart will have more impact than several competing for attention.

3. Save the Context for the Caption

Some data-driven stories spark a lot of questions and deserve deeper explanation. But cramming paragraphs of text into the visual and title itself—especially for mobile audiences—makes it instantly less shareable.

Instead, provide just enough context in the graphic so it’s still understandable if shared on its own. Then, use the caption, article, or accompanying post to offer the full background and nuance.

This approach keeps your visuals clean, while still ensuring that those who want more detail can get it.

The Bottom Line

Clarity is your best friend in data visualization. By simplifying labels, focusing on one main visual, and moving extra context to supporting text, you can make your graphics more effective, accessible, and shareable—without losing any of their storytelling power.

Got a data story that follows these principles?

Your Title Matters More Than You Think

In the world of data storytelling, a good visual catches your eye. A great caption keeps you there.

That single line of text on your graphic—what we’ll call the graphic title—can make or break how people engage with your content. It sets the tone, teases insight, and invites curiosity. 

Here are a few examples of great titles from recent top-performing posts on Voronoi:


1. Don’t Just Describe the Chart—Tease the Insight

Graphic title: Florida is the Country’s Second Fastest-Growing State

This title doesn’t just describe the data—it is the insight. It’s specific, a little surprising, and naturally invites follow-up questions like: who’s first? And how fast is Florida actually growing? Leading with a clear, compelling takeaway helps the viewer immediately grasp why the chart matters.


2. Shorter Can Be Stronger

Graphic title: Self-Made vs. Inherited Wealth

This one is almost minimal and there’s a clear juxtaposition that instantly communicates the theme. At the same time, it invites viewers to explore a timeless curiosity of who built their fortune, and who was born into it?


3. Turn the Visual Into a Question

Graphic title: Which Countries Produce Their Own Food?
 

This title works because it introduces a clear, focused question that the visual answers. Instead of summarizing the data, it sets up a discovery—prompting viewers to explore the full chart to find out how different countries compare on food self-sufficiency.


4. Add Context Without Overloading

Graphic title: Global Trade Dominance: U.S., EU, or China (2000 vs. 2024)

This one works because it taps into a global power struggle of three economic superpowers vying for dominance. The timeframe adds a layer of tension, revealing how trade influence has shifted over two decades. In a world where trade headlines dominate, the title feels timely, even without flair.


Put Your Title to Work

A strong graphic title can turn a quick glance into real engagement. Don’t miss the chance to make your title count on your next visual.

4 Visuals That Grabbed Attention Instantly (And Why)

Some visuals demand your attention before you even read the caption.

A bold number, a clever design twist, or a timely insight can be all it takes to stop someone mid-scroll.

In this edition of our Data Creator blog, we’re spotlighting four recent Voronoi posts that did just that—and what you can borrow for your next visual.

#1 S&P 500 Market Cap Hits Record $55.7 Trillion by @Soltani 📈

A simple chart and the right timing turned this post into a much bigger story.

Why it works:

  • Timely: Posted just days after the record was hit, it taps into a current milestone while it’s still fresh in people’s minds.
  • Bold Headline: $55.7 trillion is a massive figure—and leading with it grabs attention instantly.
  • Clear Narrative: Despite early-year volatility, the chart shows a strong recovery at a glance.
  • Bigger Context: With the economy, geopolitics, and trade tensions dominating headlines, this chart taps into real-world uncertainty—but also resilience.
  • Clean Design: The trend is the focus with this single line chart, free of distractions.

#2 Productivity Gains from Using AI by @visualcapitalist 🤖

AI is one of today’s most relevant topics, with this chart showing the real numbers behind the hype.

Why it works:

  • Timely and Credible: AI is dominating headlines, and this chart backs it up with research from Stanford and the World Bank.
  • Actionable: It doesn’t just show that AI is faster—it shows how much faster across a wide range of real work tasks.
  • Easy to Read: A side-by-side bar chart makes comparison effortless, even on mobile.
  • Unexpected Insights: Some of the biggest productivity gains are in areas people don’t always associate with AI—like troubleshooting, critical thinking, and judgment.
  • Impactful Scale: When you see tasks cut from 120+ minutes down to 30 or less, the impact is hard to ignore.

#3 The 40 Best Countries in the World, As Determined by the People by @visualcapitalist 😏

Everyone wants to see how their country ranks, and this chart taps right into that timeless curiosity.

Why it works:

  • Perception-Based: The ranking reflects how people around the world feel about these countries, based on 73 attributes from quality of life to cultural influence.
  • Instant Comparison: Viewers instinctively scan for their own country and size it up against others—especially near neighbors or rivals.
  • Surprise Twist: Switzerland at #1 shakes up what people might expect.
  • Simple and Shareable: A clean, emoji-enhanced list makes it highly scrollable and easy to share.

#4 Banana Production by Country (2023) by @louislugas

A playful shape can make everyday data hard to scroll past.

Why it works:

  • Fun Format: The peeled banana shape is bright, thematic, and highly scroll-stopping.
  • Snackable Depth: This chart shows the top 10, but the full ranking goes way deeper.
  • Adds Context: A quick caption adds value by briefly connecting banana production to global food security and economic resilience.
  • Simple and Relevant: With a topical crop and easy-to-read layout, this post makes global agriculture feel accessible and timely.

Bring Your Next Visual to Life

The best visuals don’t just show data—they spark curiosity.

If you’ve got an insight buried in a spreadsheet somewhere, find the story and bring it to life for your next visual.