
Start with the Story, Not the Chart
When you’re working with a fresh dataset, it’s tempting to dive right into charting. Bar chart? Line graph? Or maybe that flashy new format you’ve been meaning to try?
But here’s the catch: if you start with the chart, you risk letting the format define the story—rather than the other way around.
Start by Asking Yourself a Question
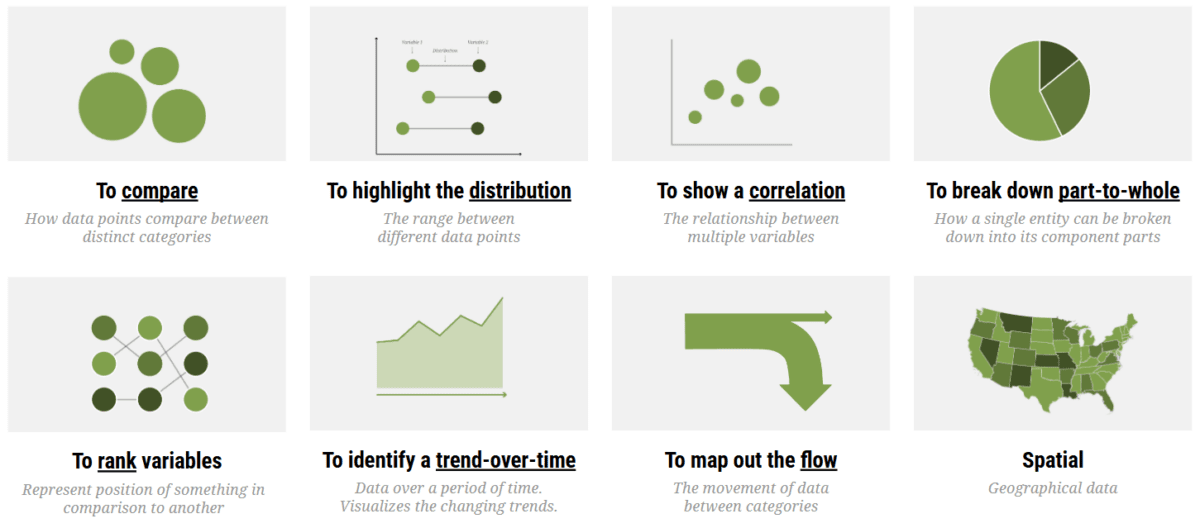
Every great visualization begins with a purpose, yet different chart types serve different purposes. Whether you’re showing change over time, highlighting a comparison, or revealing outliers, there are often dozens of possible angles when working with any given dataset.
Being able to select the appropriate chart type can make dataviz creators stand out from the crowd because the best creators aren’t just visualizing numbers, they’re framing stories.
So next time you start visualizing a dataset, first ask yourself: “What story is the dataset telling?”
Same Topic, Different Story
The chart you choose changes what people see. Consider a trending topic like the growing use of AI tools and how that translates to overall web traffic.
In the below examples we have two very different approaches to telling this emerging story.
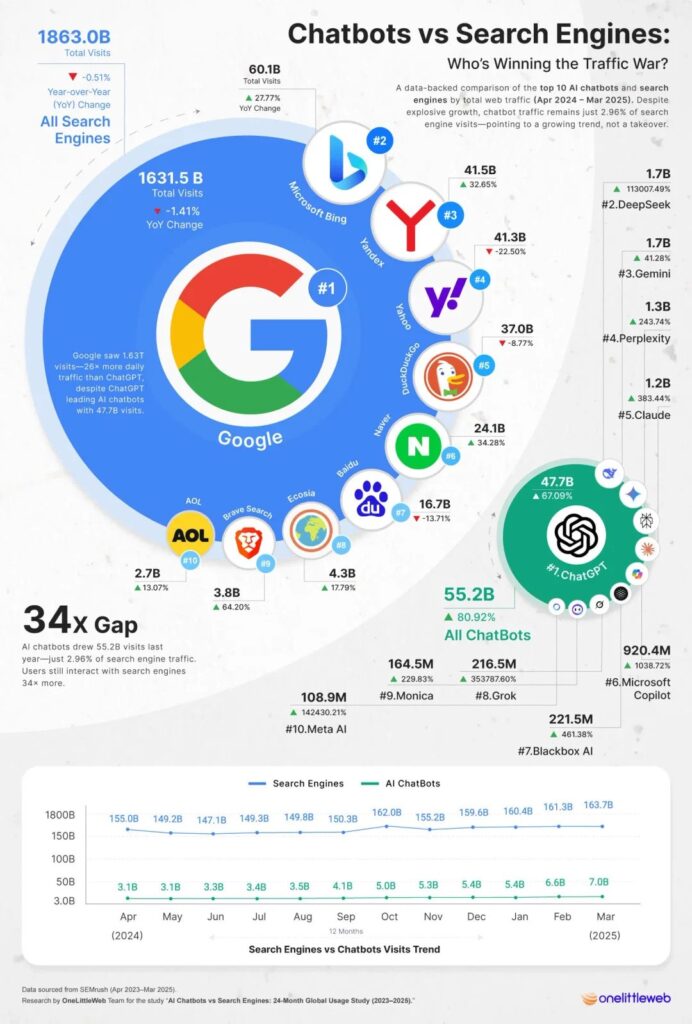
In the first chart (left) published by @sujansarkar, the absolute traffic in terms of website visits is visualized through proportionately sized circles. The takeaway hits you in the face as soon as you look at it: Google dwarfs all other websites by a huge margin, despite the recent growth of AI tools.
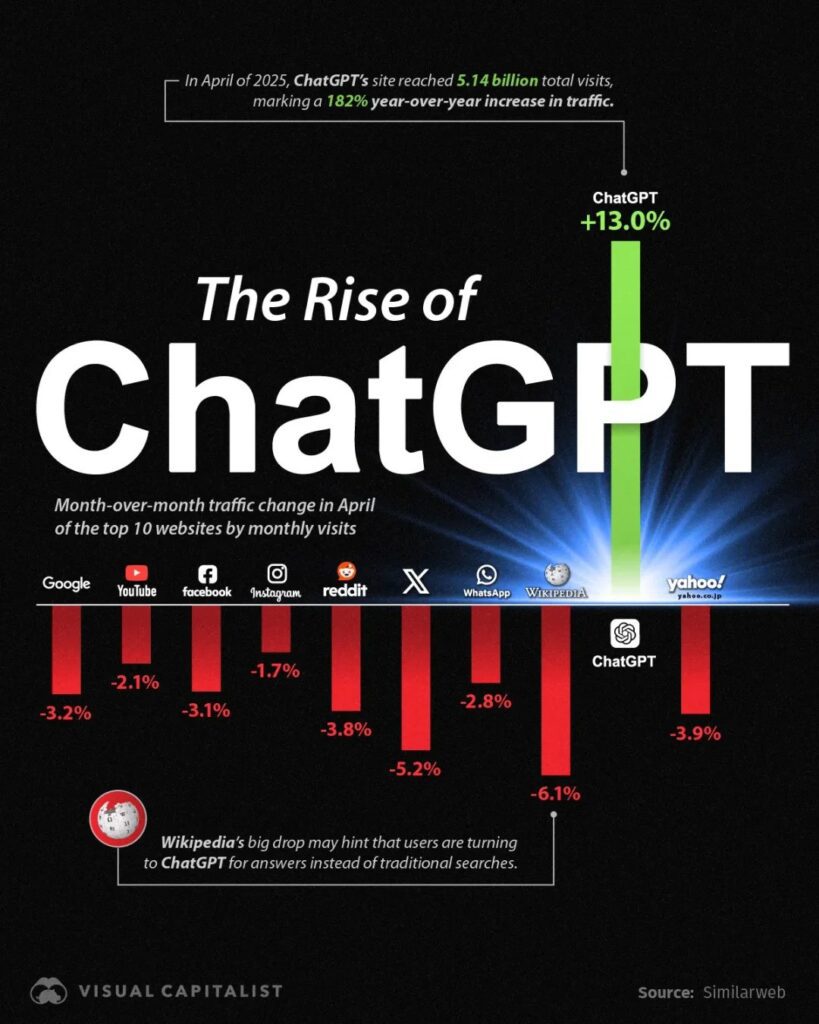
In the second chart (right) @visualcapitalist highlights the percentage growth in monthly website visits. Suddenly, the story shifts with this new perspective—what stands out now isn’t Google’s relative size, but the explosive rise of a new player: ChatGPT.
There are no wrong answers here. Both visuals are grounded in data. But each one tells a very different story.
This is the power—and responsibility—of chart selection. It’s not just about visualizing data, it’s about choosing the right lens for the message you want to reveal.
Let Intent Guide Your Next Visual
There’s no perfect chart—only the one that best fits your message. So as you’re planning your next submission, remember: frame the story first, and the right chart will follow.
Got a story to tell? Submit a visual to Voronoi now.